Data only becomes valuable once it's understood. We take your operational, survey, or financial data and turn it into clear insight — using statistical analysis, visualization, and reporting that speaks to both technical and non-technical audiences.
Whether you need a one-off analysis for a report or an ongoing dashboard that tracks performance in real time, we build the pipeline from raw data to decision-ready output.
Discuss Your Project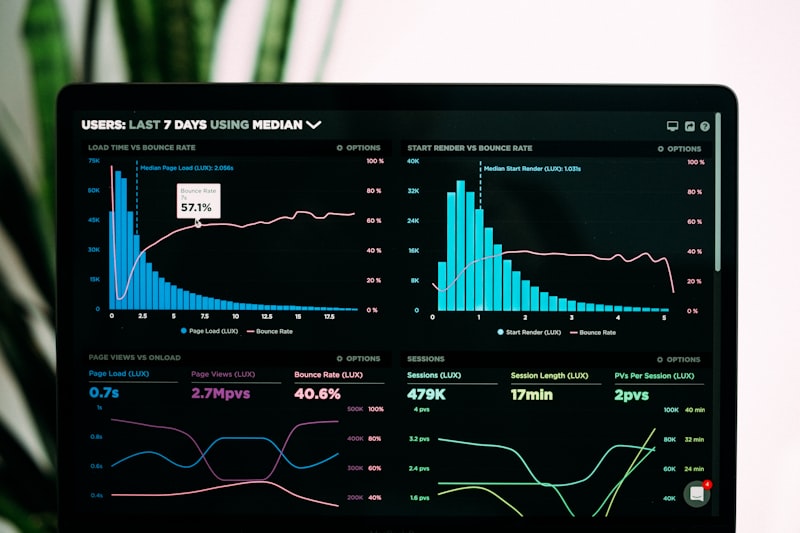
What's Included
- Data cleaning and quality checks
- Statistical and trend analysis
- Interactive dashboards and visualizations
- Custom reports for management and donors
- KPI tracking and performance monitoring
- Data storytelling for presentations and proposals
Who This Is For
- Program teams needing donor and M&E reports
- Executives who need performance dashboards
- Researchers analyzing survey or field data
- Organizations preparing data for audits or funding applications
The Payoff
Why It Matters
Evidence-Based Decisions
Base strategy and resourcing on what the data actually shows, not assumptions.
Insights Anyone Can Read
Turn complex datasets into visuals and reports stakeholders actually use.
Less Manual Number-Crunching
Automate recurring reports so your team spends less time in spreadsheets.
Ready to talk through your needs?
Get in touch and we'll recommend the right approach for your organization.